
Notes about data visualization in Python
This is a notebook intended primarily to collect notes about data visualization. The post will be constantly updated as any other notebook.
Common types of graph by purpose
Distribution
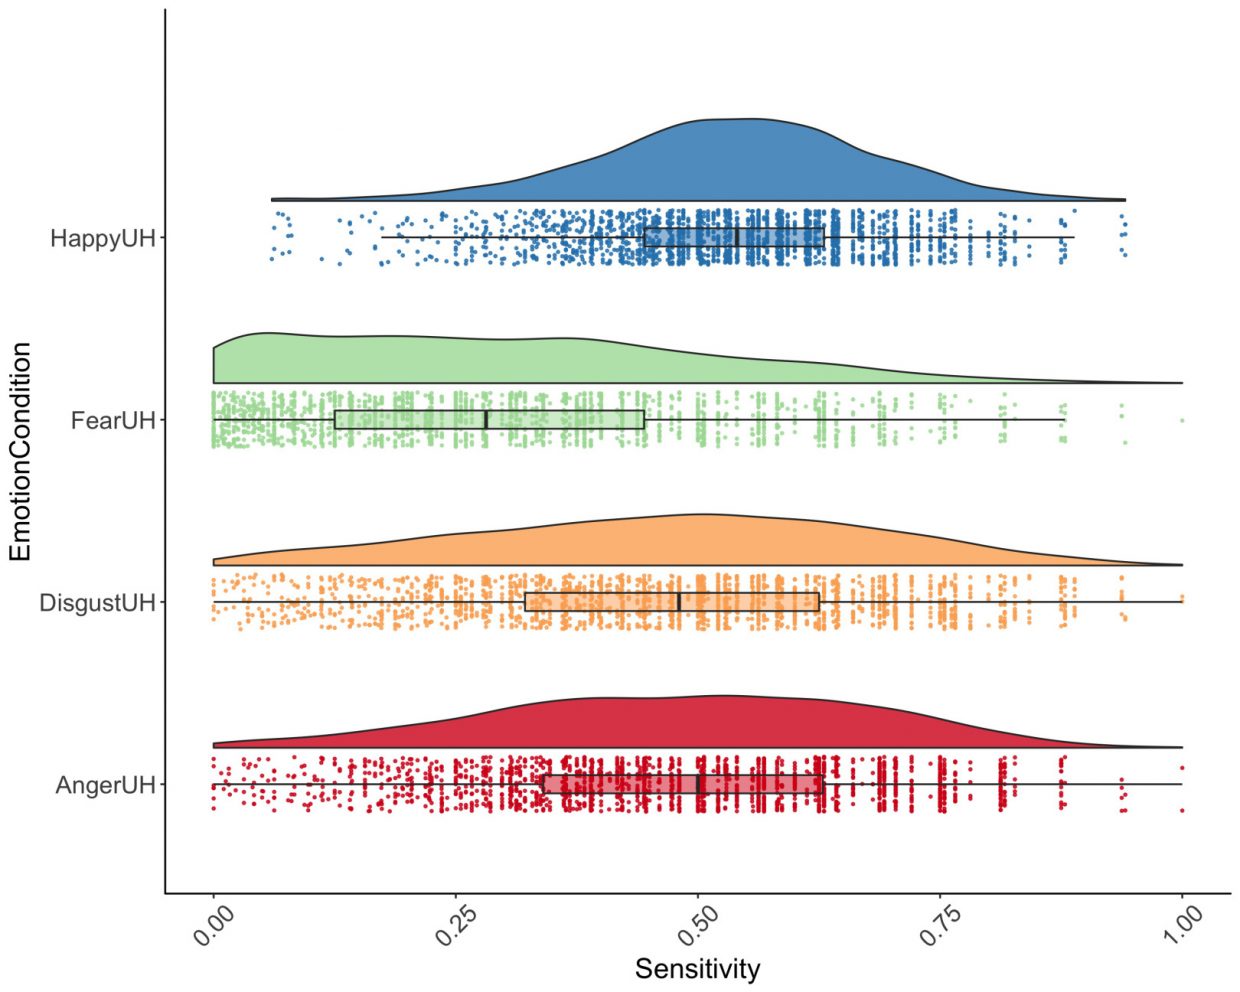
Raincloud plot
A raincloud-plot combines boxplots, raw jittered data, and a split-half violin.
The following raincloud plot was created by Dr. Micah Allen’s blog. The original plot was created in R using ggplot2. It turns out pog87 created the PtitPrince library to create the raincloud-plot easily in python.
Interesting posts
A Dramatic Tour through Python’s Data Visualization Landscape (including ggplot and Altair) How to Generate FiveThirtyEight Graphs in Python
Resources
- From data to viz: a classification of common chart types based on input data format.
Note: (Most graphs using
R, but it can be a good place to start.) - python graph gallery: types of charts with reproducible code.
- Xenographcis: A collection of unusual charts and maps.

Leave a comment